Insights
The Insights page provides interactive visualizations showing how your data evolves over time across multiple scans.
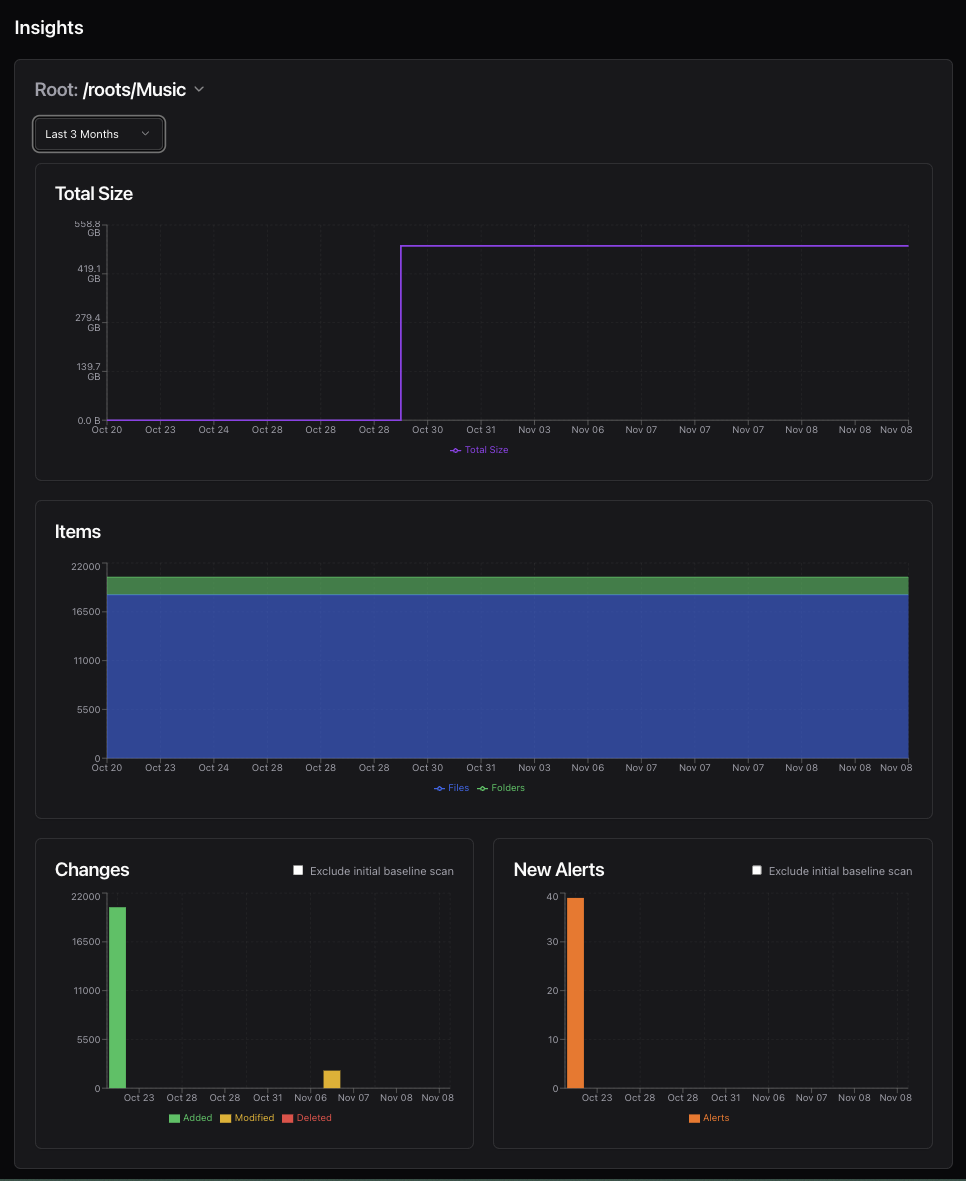
Available Charts
File Size Trends
Track total storage usage over time:
- See growth or reduction in directory sizes
- Identify storage bloat
- Displayed in both decimal (GB) and binary (GiB) units
File/Folder Count Trends
Monitor the number of items:
- Total files and folders over time
- Detect unexpected additions or deletions
- Separate trend lines for files vs. directories
Change Activity
Visualize filesystem activity:
- Additions, modifications, and deletions per scan
- Identify periods of high change
- Understand modification patterns
Alert Trends
Track integrity issues over time:
- Validation failures
- Suspicious hash changes
- Alert resolution patterns
Features
Root Selection
Select which scan root to analyze from the dropdown. Each root maintains independent trend data.
Date Range Filtering
Customize the time window:
- Last 7 days
- Last 30 days
- Last 90 days
- All time
- Custom range
Baseline Exclusion
Toggle whether to include the initial (baseline) scan in trend calculations. Baseline scans often show large numbers of “additions” which can skew trend visualizations.
Interactive Charts
- Hover for detailed values
- Pan and zoom on time ranges
- Toggle data series on/off
Requirements
Trend analysis requires multiple scans of the same root. After your first scan, you’ll see a message prompting you to run additional scans to generate trend data.
Use Cases
- Capacity Planning: Monitor storage growth rates
- Change Detection: Identify unusual modification patterns
- Validation Monitoring: Track data integrity over time
- Baseline Comparison: See how your filesystem evolves from initial state